

Accounting Basics for Board Game Designers – The Expansion
For independent board game designers who have already made their hobby into a small business, or for those who are considering upgrading their hobby into a financially viable side hustle, accounting can be one of those essential business tasks that quickly becomes a chore. As tedious as it can seem, accounting is not only important for assessing the financial health of your business, it is also a legal requirement if your company grows large enough to become publicly traded. Preparing financial statements now can not only help you take meaningful steps to grow your business, but also set you up for future reporting.
If you like the model I’m using in this article, you can have it for free! It is available for download on our templates page. This is a comprehensive model designed for independent game designers and small publishers. For details on a simpler model, check out our Essential Accounting article!
An Assumption
I made one simplifying assumption when developing this model to help make it as user-friendly as possible, while still providing everything an independent board game designer or small publisher will need:
1. Not Publicly Traded
I assume the designers using this spreadsheet are not yet publicly traded companies, and so do not need to keep track of stock or dividend payouts.
The Foundation of Accounting and Ledger
For a quick introduction to the foundational accounting equation and the concept of a ledger, I’d recommend you take a look at the Essential Accounting article. Properly filling out the ledger will ensure that the foundation of your financial statements is correct. If you are using my spreadsheet, make sure you report incoming money, such as sales, as a positive value and outflowing money, such as expenses, as (negative) values. Tracking the inflows and outflows of cash in this way will balance the fundamental accounting equation throughout the spreadsheet without any additional coding on your part.
For the remainder of this article, the data from the example ledger shown in Figure 1 will be used in creating the resulting financial statements.

Figure 1: Example Ledger
Depreciation Discussion
In addition to properly filling out the ledger, you’ll have to account for depreciation. When you purchase a new asset for your business, like a laptop, printer, or office furniture, you can deduct a portion of the overall cost of the new asset from your revenue for a certain period of time. Deducting depreciation financially reflects a reduction of the useful life of the item. It also reduces your taxable income, saving you money.
There are multiple methods for depreciating assets, but the simplest and most common is Straight Line Depreciation. Straight Line Depreciation takes the total cost of your asset, including any installation costs or upgrades, and divides that value evenly over the estimated useful life of the asset.

Figure 2: Example of Depreciation
In the case of the printer shown in the depreciation calculator tab, reproduced in Figure 2, the useful life is three years. So the total $3000 cost is depreciated in $1000 increments over a three year time frame. You pay $1000 per year until the printer is completely depreciated, at which point your yearly payment “Depreciation this year” drops to $0. This simple depreciation method does assume that the item being depreciated has no salvage value.
Salvage is the amount of money you can recoup by selling the item after you have purchased it. For example, if you sell that printer at a later date for $500 to a friend of yours, the printer’s salvage value is $500. For the sake of tracking your depreciation, it is important to document when you make that final sale. There are several ways to account for salvage, but here are the two most simple.
1. Selling property or equipment after it has fully depreciated
In the printer example, once three years have passed, the printer’s value is $0. Your printer may work fine for years to come, but by accounting standards, it has exceeded its useful life. If you then sell it for salvage, you can treat it like selling a specific piece of inventory. This revenue can be captured as “Other Revenue” in your ledger. You’ll then pay income tax on the salvage value of the asset you sold.
2. Selling property or equipment before it has fully depreciated
If the item has not yet fully depreciated, you have a little more work to do. That’s because as far as your financial statements are concerned, there is an asset on your books that has value, even though you physically sold it. Once you sell the item, make sure you remove it from your depreciation calculation and remove what remaining value it has from your property, plant, and equipment moving forward. If you are using our spreadsheet, simply make sure you completely deleted it from that tab and enter a (negative) value equal to it’s remaining life in your ledger against property, plant, and equipment. You cannot continue to depreciate an asset you no longer have!
Once you’ve removed the asset from your depreciation calculation, all you have left to do is claim the revenue as “Other Revenue” as before.
For tax purposes, there are defined useful lives for a variety of assets. For example, a printer is three years, a laptop is five, a desk or other office furniture is seven, and so on. These categories can change over time so you’ll have to periodically check with a tax accountant or through IRS websites to choose a reasonable useful life. As long as you are consistent, the exact number of years of useful life for an item is not critical for projecting the overall financial picture of your business. One good resource for useful life estimates is the MACRS Asset Life table.
Resulting Financial Statements
There are four standard financial statements – the Balance Sheet, Income Statement, Statement of Cash Flows, and Statement of Stockholders’ Equity. These four statements together provide a holistic picture of the financial health of your business. However, given the simplifying assumptions in this model, the Statement of Stockholders’ Equity, which predominantly tracks stocks and dividend payouts, will show a series of zero dollar entries, which isn’t particularly useful. Therefore, we will focus on the other three financial statements.
The Income Statement
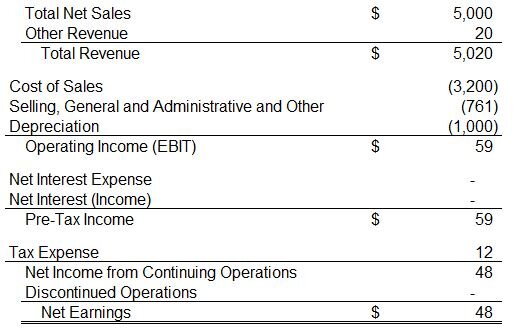
Figure 3: Example Income Statement
If you’re using our template and properly filling out the ledger, it will perform these calculations for you. Figure 3 shows an income statement as filled out with the data shown in the ledger in Figure 1, accounts for the year 1 depreciation reduction shown in Figure 2, assumes a 19.8% tax rate, and rounds to the nearest dollar.
The income statement is used to track your profitability after all expenses are paid. The major difference between this income statement and the one shown in the Essentials article is the addition of depreciation expense. In this example, a printer was purchased for $3000, and it is not yet fully depreciated. Therefore, there is $1000 of depreciation expense on this year’s income statement.
The other major addition to this income statement is a line for Discontinued Operations. If you’ve made a game and have copies of that game to sell, but you have no intention of ever paying for another print of that game, that game is discontinued. As you sell off the remaining copies, you will still gain income. However, because you do not plan on staking the future operations of your business on that product, it is accounted for separately from operating income.
One important note about discontinued operations is that it is reported on the income statement on a line after taxes are deducted, so it appears that discontinued operations are not taxed. The placement of discontinued operations on an income statement is misleading in that way. Discontinued operations is reported net of all income tax, which means income tax has already been deducted from that value. In my template, tax is automatically pulled out of whatever value you enter for discontinued operations.
The Balance Sheet

Figure 4: Example Balance Sheet
The purpose of the Balance Sheet is to capture what the value of your company is at a snap shot in time. It is a tabular representation of the foundational accounting equation: assets equals liabilities plus stockholders’ equity. The Balance Sheet is sorted by items which are current versus long term. A current item is one that is existing within one year. For example, cash and inventory can be used quickly, and accounts payable (debts owed to suppliers) are fulfilled within one year. Long term items, like a 30 year loan or equipment with useful life, exist beyond one year. It should be noted in the case of long term debt, the portion that is due in the current year (CPLTD) is a short term debt component.
If you have no debt, then the value you have as a stockholder is equal to the total assets of your company. Basically, you own your company in total, as shown in Figure 4. But if you do have debts or other liabilities, someone else who you owe money to has a claim to the future profits of your company. Therefore, your equity in the company is equal to the total assets of the company less whatever you owe someone else.
Statement of Cash Flows

Figure 5: Example Statement of Cash Flows
The purpose of the Cash Flow Statement is to track where the tangible dollars your company receives and spends actually are. The Net Earnings value is calculated from the last line on the Income Statement, shown in Figure 3. Next, depreciation is added to this value. Earlier when making the Income Statement, depreciation was subtracted from your revenue, reducing your overall taxable income. But depreciation is a reflection of the useful life of an asset. No actual dollars were transferred when accounting for that. So to get an accurate representation of tangible cash, depreciation is added back to Net Earnings.
Next, you make some comparisons of important Balance Sheet items to see if you gained or spent more money on them over the course of a year. For example, if you started with no inventory, then after a year of buying and selling products you ended with $100 of inventory, then over the course of the year, you used cash to purchase ($100) worth of inventory you didn’t have before.
Next, account for any capital expenditures, in this case the $3000 printer, you made during the year. Finally, account for any new loans or debt repayments made throughout the year.
The result will be the total amount of cash you made or spent over the course of the year. Using this statement you can easily see where you money is going. For example, your operating cash flow, the amount of cash generated from the normal buying and selling of games, is positive. Then all of that cash and then some was used on the printer purchase, resulting in an overall loss in cash over the course of the year.
Key Takeaways
Here are the key takeaways:
1. The three financial statements – Income Statement, Balance Sheet, and Statement of Cash Flows – work together to give you a complete picture of the financial health of your business. If you are a publicly traded company, the Statement of Stockholders’ Equity is also needed.
2. The Income Statement shows you if your business overall is profitable.
3. The Balance Sheet shows you how much equity of your business you own versus owe others. Additionally, it helps you identify how liquid your company is (cash is easier to spend than inventory, which first must be converted through a sale to cash).
4. The Cash Flow Statement keeps track of where your physical dollars are. It helps you identify if you are burning cash each year. If you are, you’ll have to supplement that cash burn by putting more of your own cash into the business or by financing your business activities with debt.
Looking into the Future
Now that we know how to track your finances on a day to day basis, we can use that information to make guesses about the future. Orange highlighted boxes in this model represent fields in which you need to input data. Every other field is calculated based on what you entered.

Figure 6: Prediction Model Assumptions
In the model above, I’m using the same data used throughout this article. Additionally, I made some guesses about the future, shown in Figure 6. For example, I’m guessing that the growth rate in sales for my game is 12% per year. I’m also guessing I will slowly decrease my cost of goods sold by 2%, because by selling more copies I can afford larger print runs and get the price per game reduced. In order to fill manufacturing demands, I’m assuming I will eventually begin dabbling in short term debt to be able to afford the larger print runs. It may make financial sense to carry a balance as I take out and pay off debt, resulting in a small carry over debt of 0.5%. There are other categories you can tweak to see what overall impact your changes will have on the future profitability of your business. The results of my assumptions are shown in Figure 7.

Figure 7: Prediction Model
By making a variety of assumptions, you can see how each impacts the future profitability of your company. If changing your “revenue” from 12% to -5% dramatically changes your profitability, your profitability is sensitive to sales. On the other hand, you may find that changing “other revenue” by the same amount has a marginal impact on profitability. Your future would not be sensitive to other revenue. Therefore, more of your attention should go towards monitoring “revenue” and not “other revenue”.
By creating best case and worst case financial models, you can begin to make a plan for growing your business. These models will help you determine how much financing you may need for future projects based on the amount of cash you’ll need in the next five years, or if it is feasible to hire a new employee if you expect that employee to help generate 5% greater sales. The goal is to arm yourself with reasons for why you are making the decisions you are making so you have a solid financial foundation on which to rest if something unexpected happens.
Thank you for taking the time to read this article! If you would like this template for free, please check out our templates page. If you are interested in the essential model, you can find it here.